Reports
Review fixed-window activity and create permitted exports.
Use Reports to see what happened in your tenant over a fixed window and to generate files for people who do not use the console. The page description reads “What happened in this tenant, and files for people not in the console.” It is not the live searchable event stream.
Before you start#
- You need at least one of
devices:view,gateways:view,services:view,policies:view,content_filtering:view,firewall:vieworaudit:view. Otherwise you see “You don’t have permission to view reports. Contact your administrator for access.” - Each section is gated by its own permission. Sections you cannot see are never fetched.
- The Activity window applies to event-backed cards. Device and gateway counts, and the posture snapshot, show current state and ignore the window.
- The Secure Web card shows HTTP decisions only while Inspect web traffic is on in Secure Web settings.
Review activity#
- Open Reports. The Activity tab is selected by default.
- Choose a window: 1h, 24h, 7d or 30d. The default is 24h.
- Read the header chips: “{n} of {m} devices connected” and “{n} of {m} gateways online”.
- Read the spark cards: Audit entries, Access blocks and Secure Web blocks. Each shows a count with a sparkline and links to the matching page.
- Read the view cards. Each shows a window chip and “Exportable: yes” or “Exportable: no”.
- Follow a link such as View analytics, View access audit, View devices or View audit log when you need individual evidence.
You should see counts for the window and, for Device posture, a bar split into Compliant, Non-compliant and Unknown.
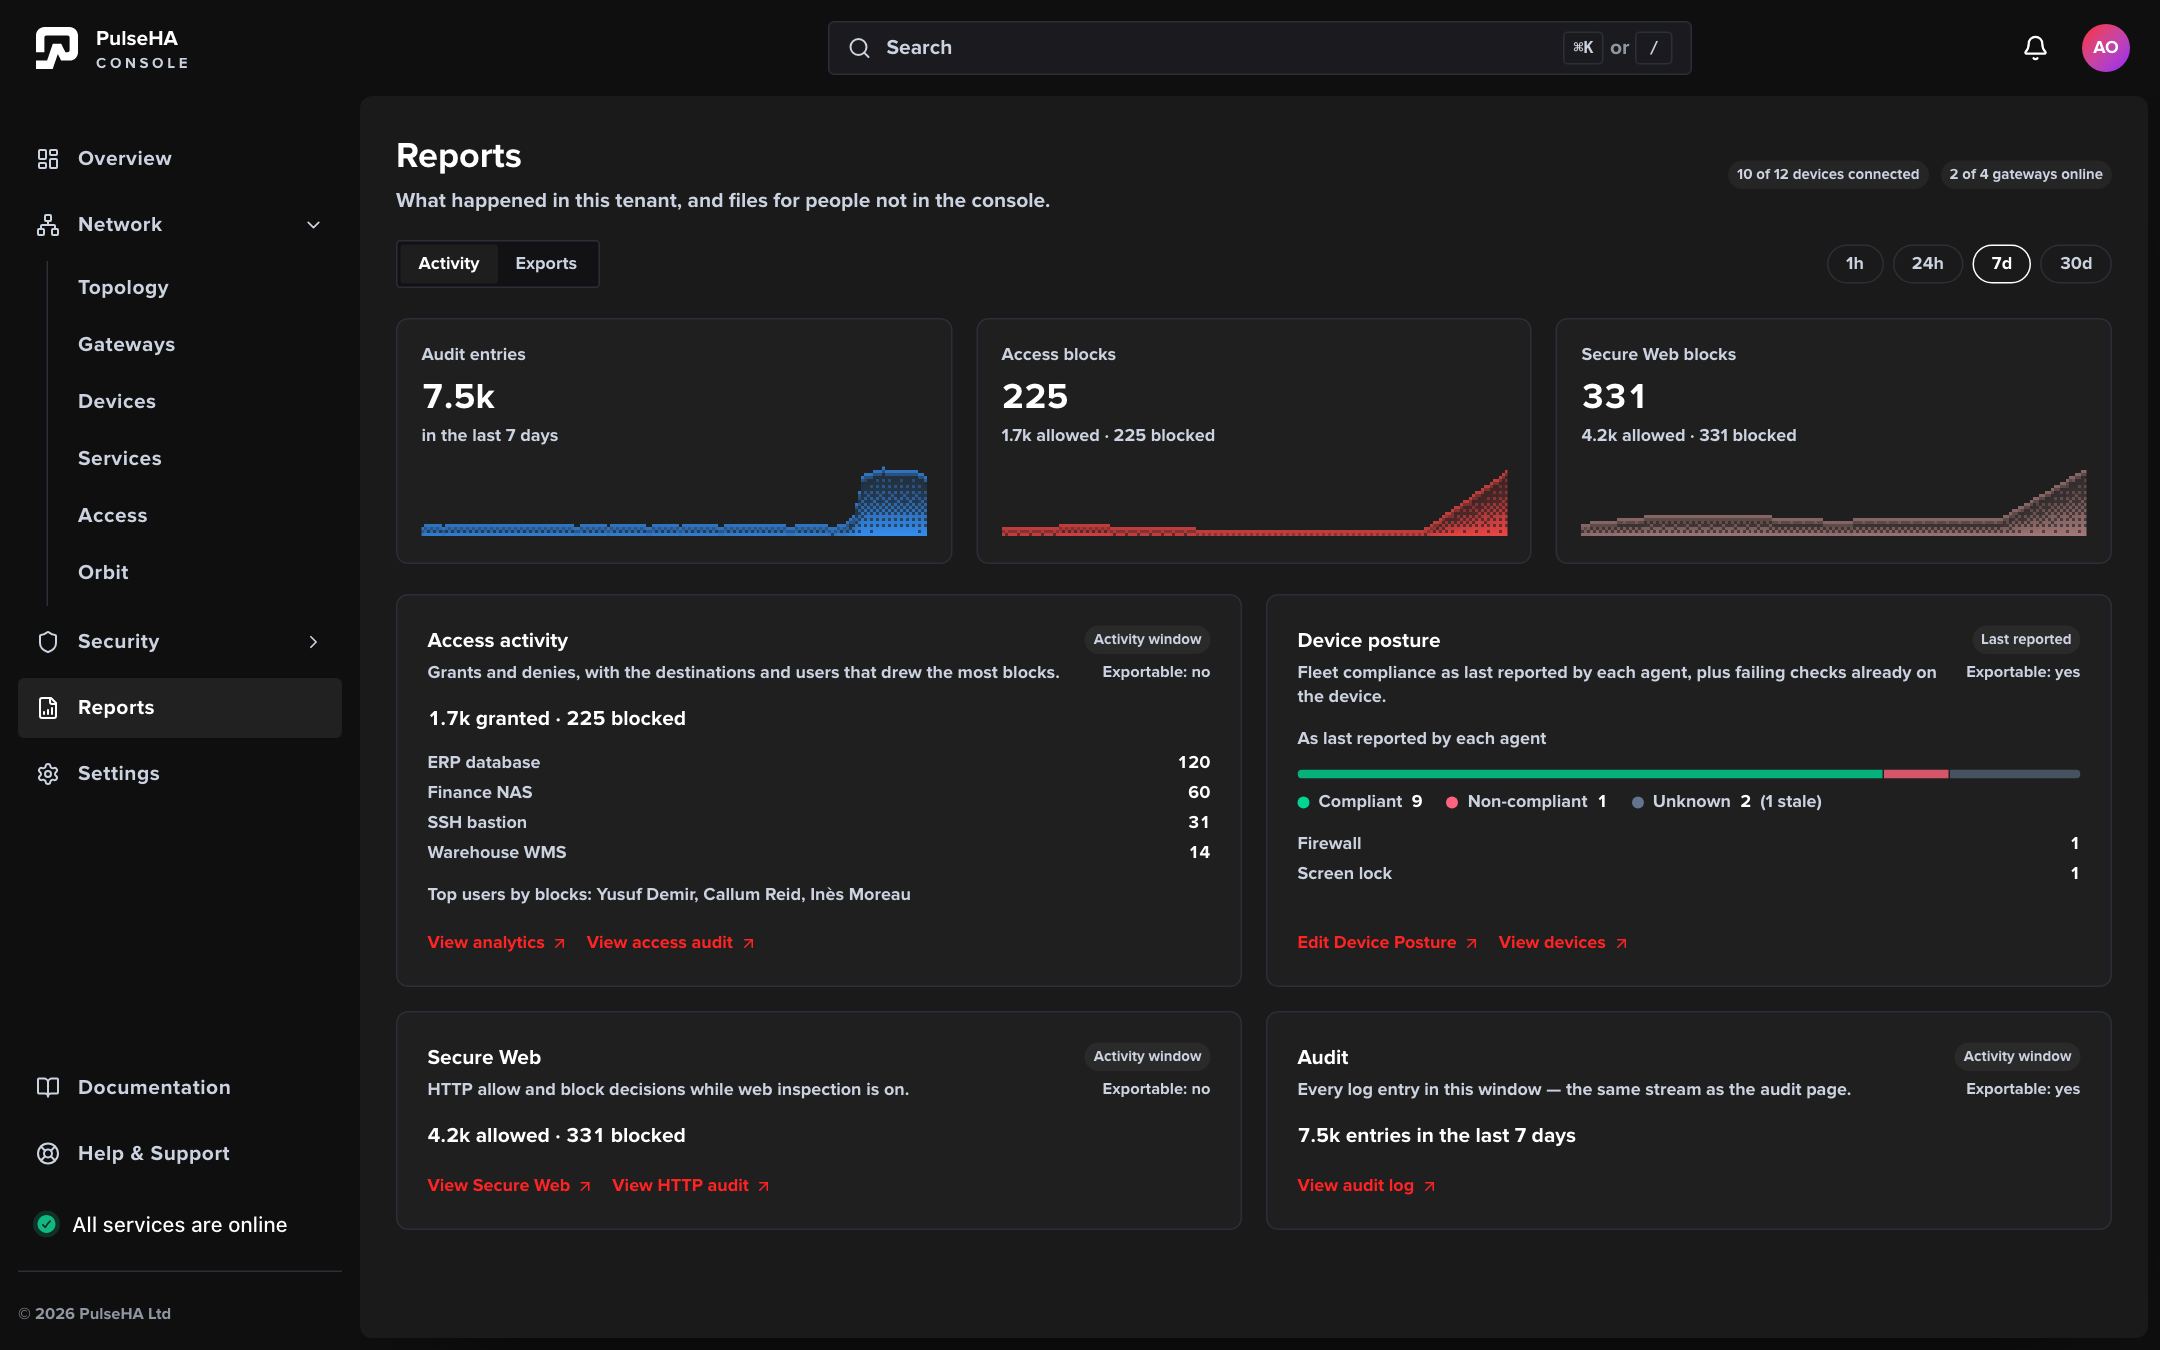
The Activity tab on a 7d window: spark cards along the top, then view cards with a window chip, an Exportable flag and links into the page that holds the evidence.
Export data#
- Open the Exports tab.
- Find the dataset. For Audit, pick its own window chip (1h, 24h, 7d or 30d). It starts from the Activity window.
- Click Generate. During an Audit export the button reads “Loading {n} of {total}…”.
- Confirm the window and contents before sharing the file.
Files are named pulseha-{dataset}-{date} with a .csv or .json extension. The Audit export is named audit-logs-{date}.csv.
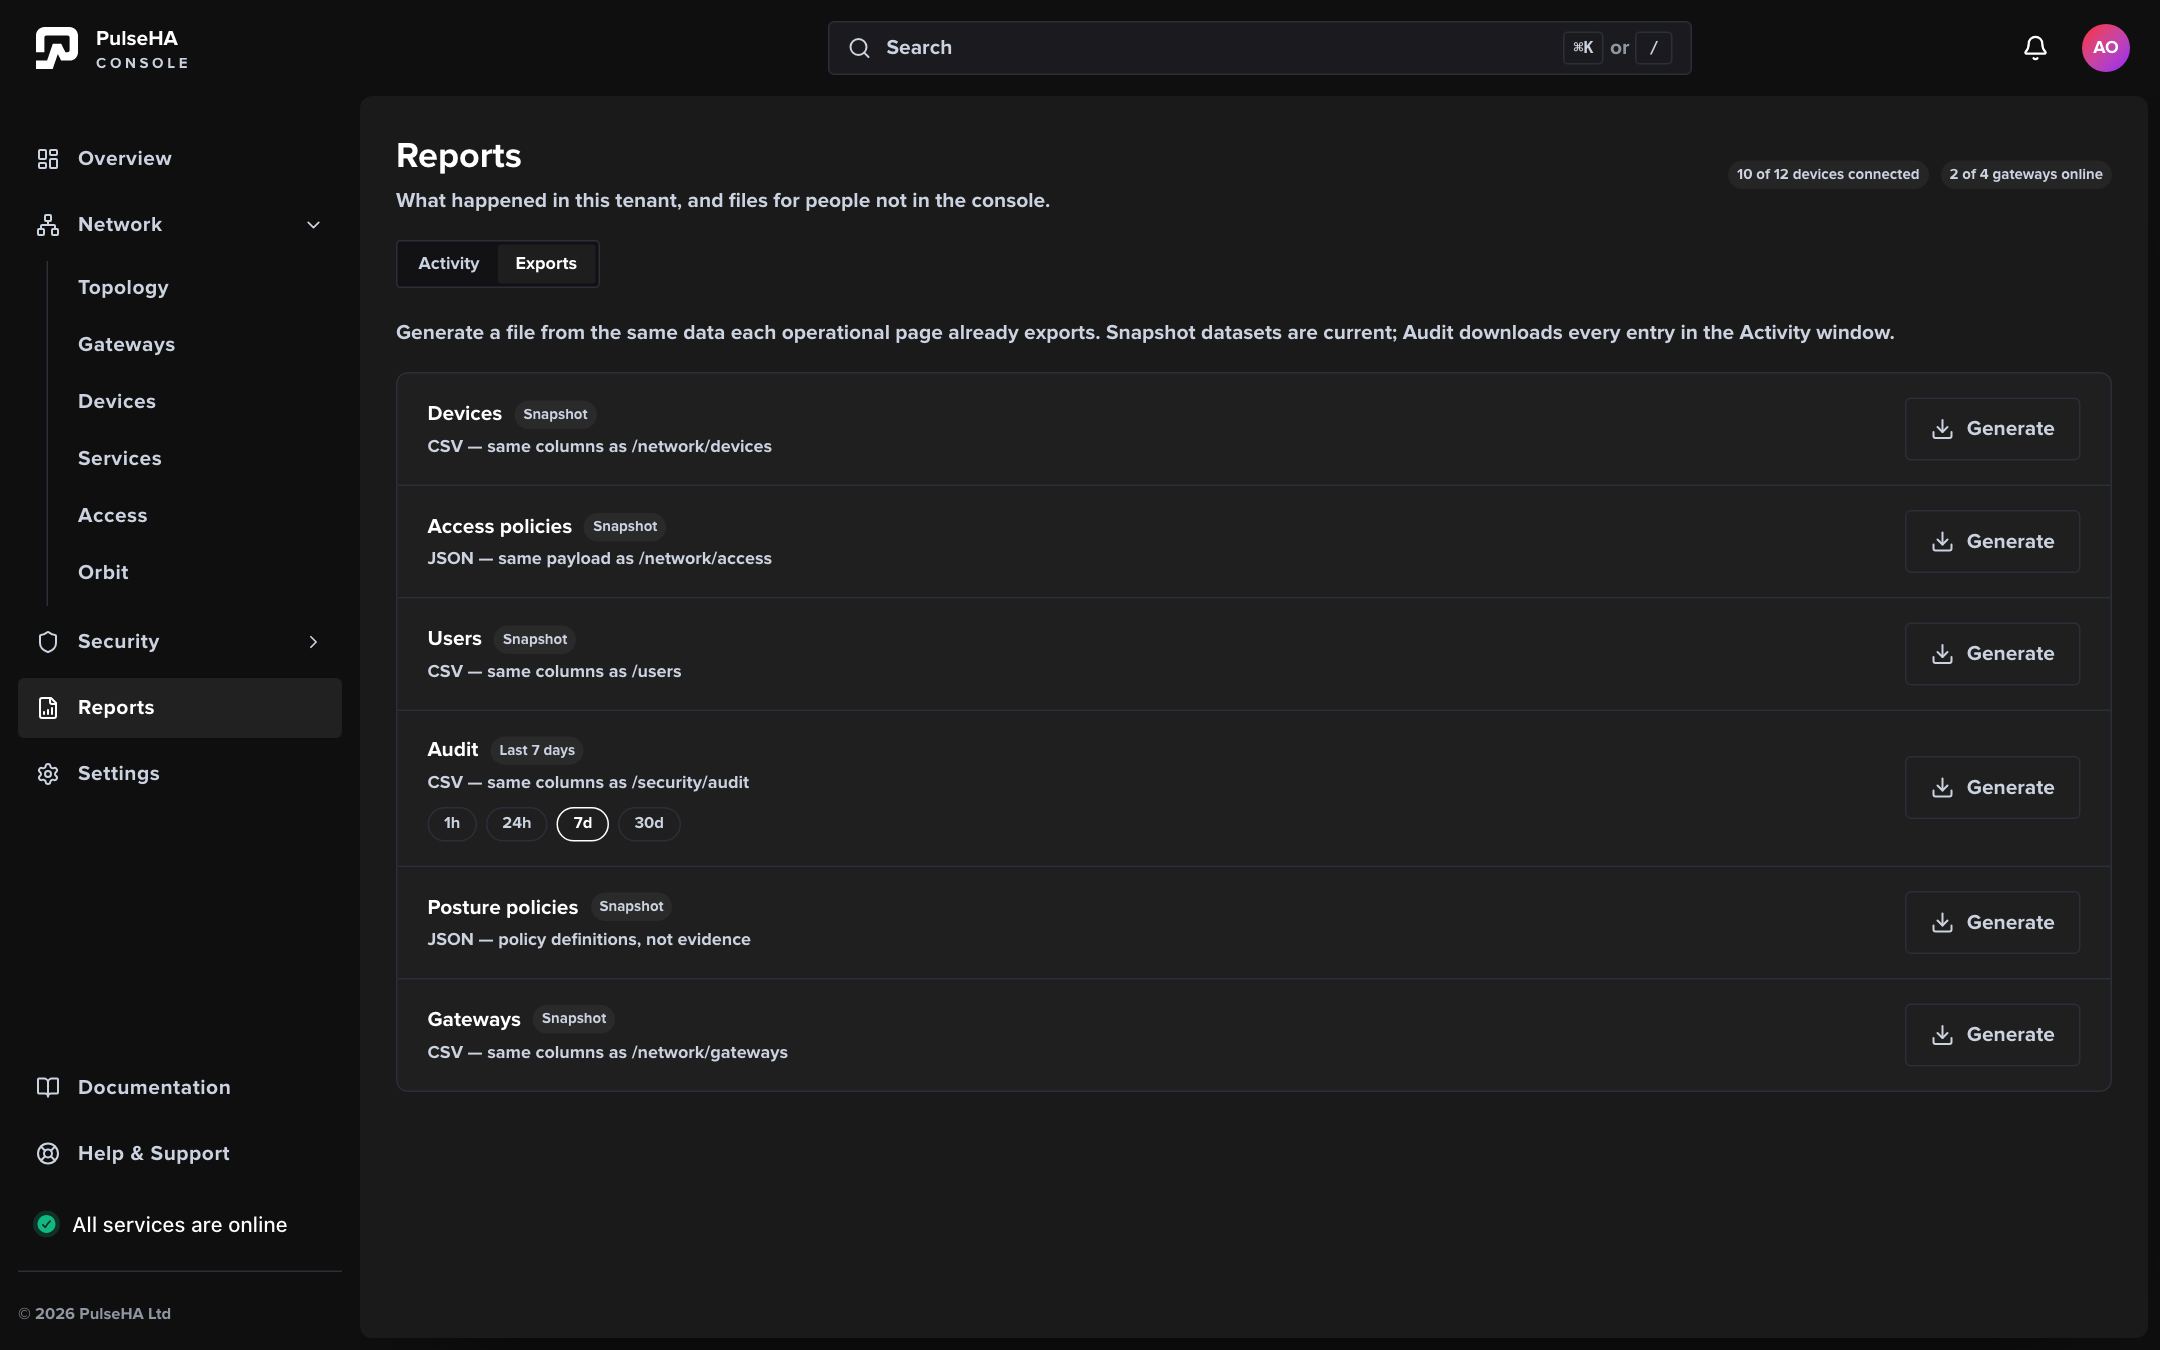
Every dataset has its own Generate button; only Audit carries a window chip because the other datasets are current snapshots.
Reference#
Activity cards#
| Card | Sentence shown | Window | Exportable |
|---|---|---|---|
| Access activity | Grants and denies, with the destinations and users that drew the most blocks. | Activity window | no |
| Device posture | Fleet compliance as last reported by each agent, plus failing checks already on the device. | Last reported | yes |
| Secure Web | HTTP allow and block decisions while web inspection is on. | Activity window | no |
| Audit | Every log entry in this window, the same stream as the audit page. | Activity window | yes |
Access activity lists the top five blocked destinations and the top three users by blocks. Device posture lists the top five failing checks. Audit shows “{n} entries in the last {window}”.
Permissions per section#
| Section | Permission | Default roles |
|---|---|---|
| Devices chip, Devices export | devices:view | owner, admin, user, readonly |
| Gateways chip, Gateways export | gateways:view | owner, admin, user, readonly |
| Access policies export | policies:view | owner, admin, user, readonly |
| Device posture card, Posture policies export | policies:view | owner, admin, user, readonly |
| Secure Web card | content_filtering:view | owner, admin, user, readonly |
| Audit entries, Access blocks, Access activity, Audit card, Audit export | audit:view | owner, admin |
| Users export | users:view | owner, admin, user, readonly |
Export datasets#
| Dataset | Format | Contents |
|---|---|---|
| Devices | CSV | Current agents, same columns as Devices, plus User email |
| Access policies | JSON | Policy definitions, same payload as Access; site-to-site policies excluded |
| Users | CSV | Users and invites with Kind, Email, Name, Role, Status, Last activity, Invited at |
| Audit | CSV | Every log entry in the chosen window, same columns as Audit |
| Posture policies | JSON | Policy definitions including disabled ones, not evidence |
| Gateways | CSV | Current gateways, same columns as Gateways |
CSV files use a UTF-8 byte order mark and CRLF line endings. Values that start with =, +, - or @ are quoted so spreadsheets do not run them as formulas.
Posture classification#
A device is Non-compliant when its last report failed. It is Unknown when no report exists, when the report is older than 10 minutes, or when the device was last seen more than 10 minutes ago (shown as stale). If no posture policy is enabled, every device is Unknown.
Troubleshooting#
- “Couldn’t load {what}. The numbers below are unavailable, not zero.” One source failed: Secure Web settings, access analytics, posture data, Secure Web analytics or audit logs. Reload before trusting the card.
- “Devices unavailable” or “Gateways unavailable” in the header. The agents or gateways call failed.
- Secure Web card reads “Web inspection is off”. Turn on Inspect web traffic in Secure Web settings if you need HTTP analytics. DNS-level decisions still appear in Audit.
- “No events in this window.” The sparkline has no data. Widen the window.
- “No datasets are available with your current permissions.” Ask an administrator for one of the view permissions above.
- “Audit export was incomplete ({n} of {total} entries). Try again.” The export fetched fewer rows than the total and refused to write a partial file. Retry, or use a shorter window.
- “Audit export exceeded the Control pagination window. Try again.” The window has too many entries to page through. Use a shorter window.
- “Export failed.” Generic failure. Retry.
Related tasks#
- Audit for filtered event inspection.
- Analytics for trends.
- Device posture to change posture policies.
- Secure Web to turn on web inspection.
- Devices and Gateways for the current inventories.